

Enjoy this Real Estate Market Report for the Omaha and surrounding communities of Bellevue, Elkhorn, Gretna, Papillion, La Vista, Ralston, Bennington, Blair, Fort Calhoun, Waterloo, Valley, Springfield, Louisville and Plattsmouth.
Get the Value of Your Home NOW!Average Home Price Ranges
The Average Sale Price for single-family homes in the Omaha area.
| Average Sold Price This Month | |
| Existing Homes | $231,624 |
| New Construction | $354,545 |
| Townhouse | $203,090 |
| Villa | $294,612 |
| Condo | $188,933 |
Housing Market Predictions
As we start the fourth quarter of 2019, buyer and seller demand for housing remains strong due to low interest rates and strong economy. The 30 year interest rate now sits at 3.5% compared to 4.89% a year ago. The low interest rates are making home ownership more affordable for first time home buyers and increasing the buying power of move up buyers. It probably won’t have much of an impact on the market due to continued inventory shortages and price increases in new construction and home prices under $250K.
Homes priced under $300,000 have been in a seller’s market for most of the year leaving the rest of the market in a neutral market.
The upcoming winter season, buyers will find fewer homes coming on the market but also less competition for the home for sale.

NEW CONSTRUCTION
New construction homes saw big gains in September although the market is much slower with prices continuing the rise. This is due to increased labor costs, shortage of labor available, material & land costs. Due to the rising costs, buyers are starting to look at existing homes as an alternative to new construction.
Listings increased 43% over the same time last year, pending sales increased 42% and Total Inventory decreased 9.9%. Median Closed Price increased 8.4%, Days on Market increased 41.9% and Months Supply of Inventory decreased 9.9%.
Year to date, new construction is still down 7.5% with closed sales lagging also at a decrease of 14.6% as compared to the same time last year.
EXISTING HOME SALES
New listings decreased 5.2%; Pending sales decreased 5% and Total Inventory decreased 10.9% for Existing Homes. Median Closed Price Increased 11.1%, Days on Market remained flat and Months Supply of Inventory decreased 5.9%.
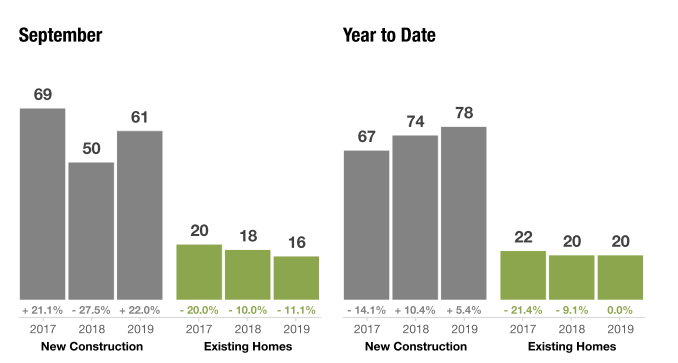
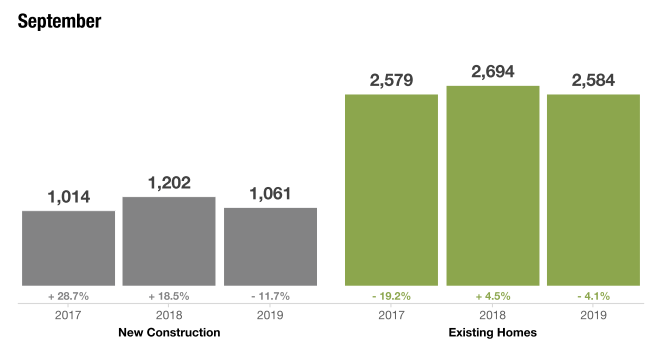
New & Existing Home Sales
This month, a total of 1769 homes were sold in the Omaha and surrounding areas which represents a increase of 9.7% over the same time last year and a decrease of 1.2 % homes sales compared to YTD last year.
| #Homes Sold Sept 2018 | #Homes Sold Sept 2019 | #Homes Sold YTD 2018 | #Homes Sold YTD 2019 |
| 1,613 | 1769 | 15,554 | 14,981 |
Existing Home Sales
This month, a total of 1,483 existing homes were sold in the Omaha and surrounding areas, which is a 5% increase compared to the same time last year. When we take a look at Year to Date home sales of existing homes, there was a decrease of 3.1% in homes sold.
| Closed Sales 2018 September |
Closed Sales 2019 September |
Closed Sales YTD 2018 September |
Closed Sales YTD 2019 September |
| 1.413 | 1.483 | 13,505 | 13,085 |
Average Days on Market
The Average Days on market represents the number of days between when a property is listed and when an offer is accepted in a given month.
Days on Market – 12 Month Look Back
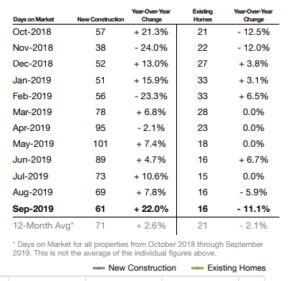
Days on Market by Property Type
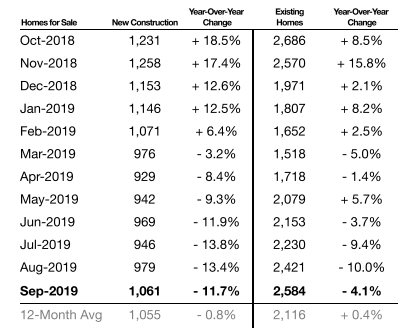
Inventory of Homes for Sale
The total number of Existing Homes for sale at the end of the month in the local Omaha area was 1,701 which is -5.3% over the same time last year.
New Construction was at 732 homes for sale at the end of the month, which is -9.9% over the same time last year.
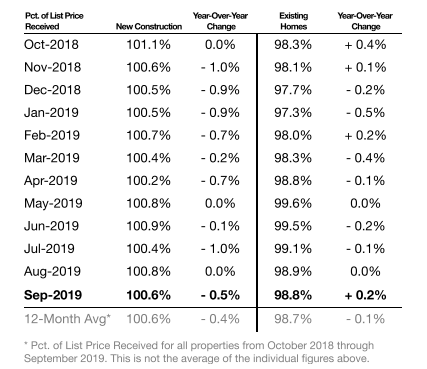
Percentage of List Price Received
Due to the low inventory of homes for sale, homes in Omaha are selling very close to the price they are originally listed for, which is great new for Homes Sellers in the Omaha area.
New Construction homes are up .6% which is the second time this year that they are not in the negative. Existing homes are also up .5%.
Expired Listings in Omaha Nebraska
There were 131 home listings that expired in the local area, down from 174 the previous month. 2157 listing contracts expired so far in 2019.
The seller may have relisted with the same agent, another agent, or may have postponed selling their house altogether. Another seller option is deciding to lease the property for rental income rather than selling.
Mortgage rates are still very low and Omaha is still a hot market for the home seller.
Bellevue Market Values
The Bellevue Nebraska Housing Market ended the month with the average home sold price of $213,546, an increase of $3,578 from the previous month.
| Average Sold Price | |
| Single Family Home | $217,282 |
| Townhouse | $174,900 |
Papillion Market Values
The Papillion Nebraska Housing Market ended the month with a decrease in the average Single-Family Home Sold Price as compared to the previous month.
| Last Month | This Month |
| $304,11 | $293,609 |
Elkhorn Market Values
The Elkhorn Nebraska Housing Market had an average sales price of $421,531, an increase over the previous month.
Bennington Market Values
The Bennington Nebraska Housing Market ended the month with the average home price of $312,174 which is a decrease over the previous month.
LaVista Market Values
The LaVista Nebraska Housing Market ended the month with the average home price of $198,120 which is a decrease of 18.7% from the previous month.
Ralston Market Values
The Ralston Nebraska Housing Market ended the month with the average home price of $149,900, which is an increase of $40,000 from the previous month.
Home Values by City
The Average Home Sale Price of Homes for Sale in Omaha and surrounding Communities by City
| City | Average Sold Price |
| Bellevue | $217,282 |
| Bennington | $182,000 |
| Blair | $269,424 |
| Elkhorn | $421,531 |
| Fort Calhoun | $662,500 |
| Fremont | $203,761 |
| La Vista | $201,476 |
| Lincoln | $2239,714 |
| Louisville | $155,333 |
| Omaha | $229,193 |
| Papillion | $292,107 |
| Plattsmouth | $216,375 |
| Ralston | $149,900 |
| Springfield | $220,000 |
| Valley | $329,772 |
| Waterloo | $525,985 |
Average Home Sale Prices by Zip Code, City & County
Search the average home sale price by city, zip code or County.
| Zip Code | City | County | Average Sales Price |
| 68005 | Bellevue | Sarpy | $195,979 |
| 68007 | Bennington | Douglas | $314,720 |
| 68008 | Blair | Washington | $263,775 |
| 68022 | Elkhorn | Douglas | $468,989 |
| 68023 | Fort Calhoun | Washington | $662,500 |
| 68028 | Gretna | Sarpy | $331,822 |
| 68046 | Papillion | Sarpy | $299,096 |
| 68048 | Plattsmouth | Cass | $209,605 |
| 68059 | Springfield | Sarpy | $220,000 |
| 68064 | Valley | Douglas | $316,041 |
| 68069 | Waterloo | Douglas | $525,985 |
| 68102 | Omaha | Douglas | $215,900 |
| 68104 | Omaha | Douglas | $152,467 |
| 68105 | Omaha | Douglas | $157,616 |
| 68106 | Omaha | Douglas | $175,108 |
| 68107 | Omaha | Douglas | $119,792 |
| 68108 | Omaha | Douglas | $114,811 |
| 68110 | Omaha | Douglas | $52,250 |
| 68111 | Omaha | Douglas | $70,583 |
| 68112 | Omaha | Douglas | $118,358 |
| 68114 | Omaha | Douglas | $241,165 |
| 68116 | Omaha | Douglas | $269,404 |
| 68117 | Omaha | Douglas | $140,000 |
| 68118 | Omaha | Douglas | $274,964 |
| 68122 | Omaha | Douglas | $197,776 |
| 68123 | Omaha | Douglas | $227,935 |
| 68124 | Omaha | Douglas | $233,540 |
| 68127 | Omaha | Douglas | $187,386 |
| 68128 | Omaha | Douglas | $208,919 |
| 68130 | Omaha | Douglas | $328,628 |
| 68131 | Omaha | Douglas | $159,877 |
| 68132 | Omaha | Douglas | $267,105 |
| 68133 | Papillion | Sarpy | $269,857 |
| 68134 | Omaha | Douglas | $192,932 |
| 68135 | Omaha | Douglas | $246,994 |
| 68136 | Omaha | Douglas | $296,139 |
| 68137 | Omaha | Douglas | $189,046 |
| 68138 | Omaha | Sarpy | $207,639 |
| 68142 | Omaha | Douglas | $345,500 |
| 68144 | Omaha | Douglas | $247,276 |
| 68147 | Bellevue | Sarpy | $201,000 |
| 68152 | Omaha | Douglas | $258,428 |
| 68154 | Omaha | Douglas | $278,435 |
| 68157 | Omaha | Sarpy | $161,250 |
| 68164 | Omaha | Douglas | $213,744 |
| Douglas | $240,768 | ||
| Sarpy | $253,789 | ||
| Cass | $220,843 | ||
| Washington | $270,940 |
