Omaha Real Estate Market Trends for September 2017
Omaha Real Estate Market Trends for September 2017
Enjoy Omaha’s Real Estate Market Trend Report for this month. Search all homes for sale on the MLS by city and price point, search by map, save your favorite properties and set up a search and be alerted as soon as a matching property hits our database and find out the value of your home.
In this Month’s Issue of the September 2017 issue of the
Omaha Real Estate Market Trends provided by Connie Betz
Discover what’s trending: how many listings are hitting the market? Is there a shortage of homes on the market and if so, how is that affecting the sales price? How long do homes stay on the market before selling? What’s the median home value in the Omaha area this month? What does this mean for you? Here’s the deal:
September saw 1,165 single family homes sell, down 5.41% from the same time last year. Properties sold for an average list price of $220,920 and average sales price of $217,958. The average number of days it took to sell was 22 days on market.
| If you are thinking of selling and want to know what your home could sell for in today's Omaha Real Estate Market, use this Instant Home Valuation Estimate or call 402-880-9027. We serve Omaha, Bellevue, Papillion, Elkhorn, Bennington, La Vista, Ralston, Plattsmouth, Blair, Fort Calhoun, Waterloo, Valley and Fremont and if you are moving outside the area, have network partners across the nation who really care about their clients and will work tirelessly on your behalf. |
Omaha Housing Market Slowing Down
 |
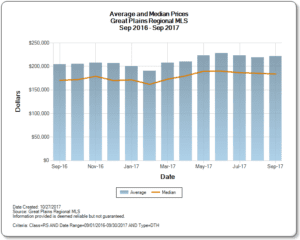
The Average Sales Price of single family homes in Omaha real estate market dropped significantly over the previous month and is still above June 2017’s Average Sales Price for homes in the Omaha real estate market. Home prices are at the fourth highest average for the past year and is a little bit above the average for January 2017. |
Search the Omaha MLS
Average Sales Price by Number of Bedrooms for Single Family Homes
Omaha Real Estate Market Trends for Single Family Homes
Average Sales Price by Bedroom for Single Family Homes in Omaha Nebraska for September 2017
2 Bedrooms or Less $138,533
3 Bedrooms $183,470
4 or more Bedrooms $308,681
A Look At The Condo & Town Home Market
Omaha Real Estate Market Trends for the Condo & Townhome Market
190 Condos/Town homes were listed for sale in the month of September. 10.5% of these homes were rejected by the market.
Average List Price $230,710
Average Sales Price $212,406
Average Days On Market (DOM) 38 – same Days on Market as of September 2017
# of Condo & Town homes that DID NOT sell – 18
Distressed Housing Market Trends in Omaha Nebraska
Forty nine distressed bank owned homes were offered for sale this month in the Omaha and surrounding communities. These homes were either a bank foreclosure or a short sale home for sale. Twenty nine of these Omaha homes were sold in the month of September and 4 homes did not sell and were removed from the market.
Avg List Price $88,137
Avg Sold Price $87,074
Avg Days on Market (DOM) 21
Search All Bank Owned Homes For Sale
What Does This Data Mean?

With three more months left in 2017, it looks like we are on track to close a few more homes than were sold in 2016.
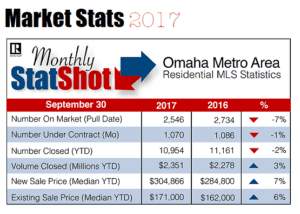
Inventory of homes for sale continues to be low and this month we have 6% fewer homes for sale in the Omaha area than the same time last year. The number of pending homes slowed considerably from last month to this month and we are at -1%. With considerably fewer homes going under contract the market is slowing despite the shortage of homes and as a result, we should expect to see fewer home sales next month.
This shortage of homes on the market drove prices up this month. Because of there are significantly fewer homes under contract this month, home prices could begin to drop next month, despite the home shortage.
How Can this Data Help if You Are Buying a House in Omaha?
The housing market is slowing down a bit compared to earlier in the year and we are still in a seller’s market. We have fewer homes pending than a year ago which means there will be fewer home sales next month, in October. If fewer homes sell in the Omaha Real Estate Market we should expect to see home prices stalling or starting to drop in October.
Omaha home owners considering moving should do so while we are still in a home seller’s market here in Omaha Nebraska to ensure you receive the highest value for your home. Interest rates are still low and the Omaha real estate market trend for buyer demand for homes in the winter months typically drops leaving only serious home buyers.
Where is the Benefit of this Data if You Are Selling a House in Omaha?
The biggest challenge facing home seller’s is finding a home to buy once their home is sold. One of the market trends this is creating is a Ghost Inventory of homes for sale – a growing list homes that “could” be coming on the market that few people know about. We are seeing an increase in home owner’s insisting on finding a home first before their home comes on the market. While the Omaha real estate market has slowed down since the Spring, it is still a seller’s market. For that reason, most seller paid concessions are for first time home buyers in homes priced under $200k.
Wondering what your home might be worth? Find out here!

