

Enjoy this July 2019 Real Estate Market Report for the Omaha and surrounding communities of Bellevue, Elkhorn, Gretna, Papillion, La Vista, Ralston, Bennington, Blair, Fort Calhoun, Waterloo, Valley, Springfield, Louisville and Plattsmouth. See all listings available for sale and set up a home search to get notified as new properties come on the market.
Get the Value of Your Home NOW!Average Home Price Ranges through July 31, 2019
The Average Sale Price for single-family homes in the Omaha area through July 31, 2019.
| Existing Homes | $226,935 |
| New Construction | $350,564 |
| Townhouse | $211,272 |
| Villa | $317,877 |
| Condo | $184,348 |
Housing Market Predictions
There is still a significant inventory shortage for homes priced under $200,000. Expect to see a higher demand for homes in this price point as they come available and multiple offers. 2019 will continue to be a good real estate market for both buyers and sellers.
New & Existing Home Sales
This month, a total of 1413 homes were sold in the Omaha and surrounding areas which represents a 1.1% increase over the same time last year and a decrease of 7.5 % homes sales compared to YTD last year.
| #Homes Sold July 2019 | #Homes Sold July 2018 | #Homes Sold YTD 2019 | #Homes Sold YTD 2018 |
|---|---|---|---|
| 1413 | 1397 | 8257 | 7641 |
Existing Home Sales
This month, a total of 1293 existing homes were sold in the Omaha and surrounding areas. 3.5% more homes sold this month compared to the same time last year. When we take a look at Year to Date home sales of existing homes, there was a 6.6% decrease in homes sold.
| Closed Sales 2018 | Closed Sales 2019 | Closed Sales YTD 2018 | Closed Sales YTD 2019 |
|---|---|---|---|
| 1249 | 1293 | 7230 | 6753 |
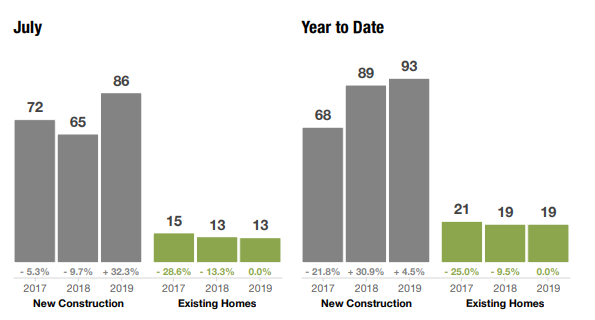
Average Days on Market
The Average Days on market represents the number of days between when a property is listed and when an offer is accepted in a given month.
Days on Market – 12 Month Look Back
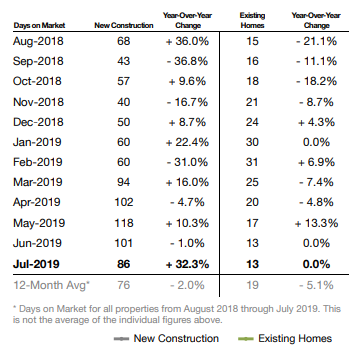
Days on Market by Property Type
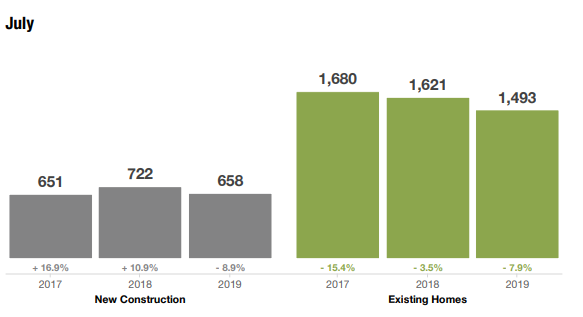
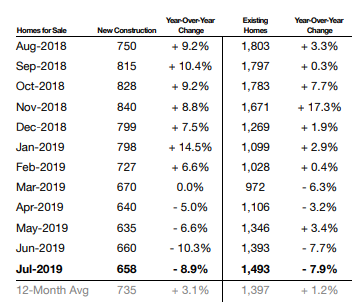
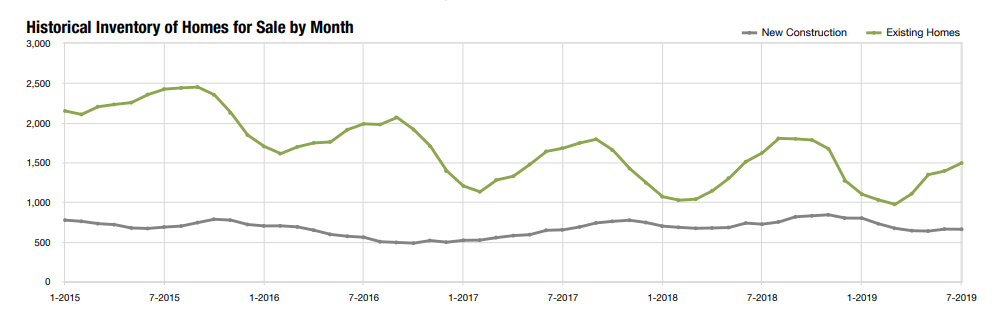
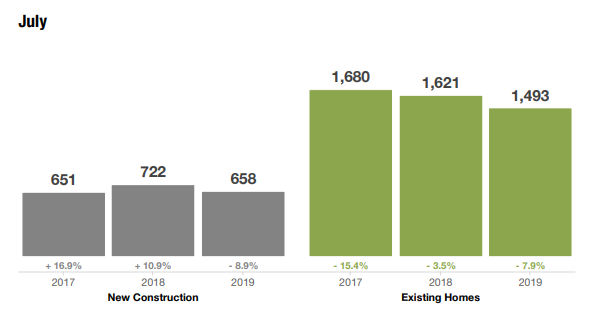
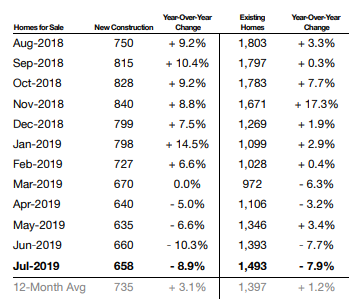
Inventory of Homes for Sale
The total number of properties available for sale at the end of the month in the Omaha area in July of 2019 was 2151, which is down 8.2% over the same time last year.
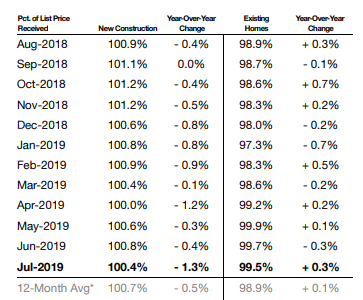
Percentage of List Price Received
Homes in Omaha are selling very close to the price they were originally listed for. Homes not priced right may be reflected in the number of expired listings rather than sales.
Expired Listings in Omaha Nebraska
There were 189 home listings that expired in the month of July in the local Omaha area. 1628 listing contracts expired so far in 2019.
The seller may have relisted with the same agent, another agent, or may have postponed selling their house altogether. Another seller option is deciding to lease the property for rental income rather than selling.
Mortgage rates are still very low and Omaha is still a hot market for the home seller.
Bellevue Market Values
The Bellevue Nebraska Housing Market ended July 2019 with the average home price of $209,968, a drop of $5,038 from June’s average of $204,930. This does not predict a drop in home prices necessarily.
MLS Chart
| Singe Family Homes | $210,976 |
| Townhouse | $151,000 |
Papillion Market Values
The Papillion Nebraska Housing Market ended July 2019 with an increase in the average single-family home price over the previous month of $5,832.
| 2018 | 2019 |
|---|---|
| $311,957 | $317,789 |
Elkhorn Market Values
The Elkhorn Nebraska Housing Market ended July 2019 with the average home price of $369,809, which is an increase of more than $35,000 over the previous month.
Bennington Market Values
The Bennington Nebraska Housing Market ended July 2019 with the average home price of $320,281, which is an increase of more 7.4% over the previous month.
LaVista Market Values
The LaVista Nebraska Housing Market ended July 2019 with the average home price of $259,440, which is a decrease of 3.8% from the previous month.
Ralston Market Values
The Ralston Nebraska Housing Market ended July 2019 with the average home price of $175,782, which is a decrease of 5.9% from the previous month.
Historical Inventory of Homes for Sale By Month
Home Values by City
The Average Home Sale Price of Homes for Sale in Omaha and surrounding Communities by City
| July 2019 | |
|---|---|
| Bellevue | $209,968 |
| Bennington | $320,281 |
| Blair | $181,350 |
| Elkhorn | $369,806 |
| Fort Calhoun | $300,666 |
| Fremont | $191,002 |
| La Vista | $259,442 |
| Lincoln | $227,943 |
| Louisville | $291,793 |
| Omaha | $244,642 |
| Papillion | $317,789 |
| Plattsmouth | $185,277 |
| Ralston | $175,782 |
| Springfield | $282,656 |
| Valley | $401,337 |
| Waterloo | $760,666 |
Average Home Sale Prices by Zip Code, City & County
Search the average home sale price by city, zip code or County. Use the Search Box at the top right corner to quickly find the information you are looking for.
| Zip Code | City | County | Average Sale Price for July 2019 |
|---|---|---|---|
| 68005 | Bellevue | Sarpy | $184,620 |
| 68007 | Bennington | Douglas | $313,939 |
| 68008 | Blair | Washington | $176,926 |
| 68022 | Elkhorn | Douglas | $409,263 |
| 68023 | Fort Calhoun | Washington | $300,666 |
| 68028 | Gretna | Sarpy | $297,498 |
| 68046 | Papillion | Sarpy | $334,190 |
| 68048 | Plattsmouth | Cass | $185,277 |
| 68059 | Springfield | Sarpy | $337,387 |
| 68064 | Valley | Douglas | $414,701 |
| 68069 | Waterloo | Douglas | $760,666 |
| 68102 | Omaha | Douglas | $294,441 |
| 68104 | Omaha | Douglas | $159,733 |
| 68105 | Omaha | Douglas | $168,462 |
| 68106 | Omaha | Douglas | $197,767 |
| 68107 | Omaha | Douglas | $144,260 |
| 68108 | Omaha | Douglas | $155,857 |
| 68110 | Omaha | Douglas | $55,000 |
| 68111 | Omaha | Douglas | $70,163 |
| 68112 | Omaha | Douglas | $175,276 |
| 68114 | Omaha | Douglas | $271,925 |
| 68116 | Omaha | Douglas | $277,015 |
| 68117 | Omaha | Douglas | $129,546 |
| 68118 | Omaha | Douglas | $376,036 |
| 68122 | Omaha | Douglas | $205,437 |
| 68123 | Bellevue | Sarpy | $243,068 |
| 68124 | Omaha | Douglas | $264,625 |
| 68127 | Omaha, Ralston | Douglas | $292,456 |
| 68128 | La Vista | Douglas | $257,538 |
| 68130 | Omaha | Douglas | $369,254 |
| 68131 | Omaha | Douglas | $157,127 |
| 68132 | Omaha | Douglas | $301,218 |
| 68133 | Papillion | Sarpy | $285,235 |
| 68134 | Omaha | Douglas | $194,411 |
| 68135 | Omaha | Douglas | $256,962 |
| 68136 | Omaha | Douglas | $311,123 |
| 68137 | Omaha | Douglas | $193,502 |
| 68138 | Omaha | Sarpy | $189,370 |
| 68142 | Omaha | Douglas | $338,873 |
| 68144 | Omaha | Douglas | $206,443 |
| 68147 | Bellevue | Sarpy | $149,459 |
| 68152 | Omaha | Douglas | $234,985 |
| 68154 | Omaha | Douglas | $341,555 |
| 681547 | Omaha | Sarpy | $200,500 |
| 68164 | Omaha | Douglas | $256,664 |
| Douglas | $253,574 | ||
| Sarpy | $267,451 | ||
| Cass | $200,500 | ||
| Washington | $256,664 |
