

Enjoy this Real Estate Market Report for the Omaha and surrounding communities of Bellevue, Elkhorn, Gretna, Papillion, La Vista, Ralston, Bennington, Blair, Fort Calhoun, Waterloo, Valley, Springfield, Louisville and Plattsmouth.
Get the Value of Your Home NOW!Average Home Price Ranges
The Average Sale Price for single-family homes in the Omaha area.
| Average Sold Price This Month | |
| Existing Homes | $238,343 |
| New Construction | $367,353 |
| Townhouse | $201,669 |
| Villa | $307,163 |
| Condo | $216,468 |
Housing Market Predictions
Interest rates are decreasing and the market still has a very low inventory of homes for sale which is making it challenging for home buyers to find and purchase a home. The lower interest rates probably won’t be able to help first time home buyers as the lower rate doesn’t solve a lack of inventory nor historically high home prices.

NEW CONSTRUCTION
New listings increased 5.8%; Pending sales decreased 20.6% and Total Inventory decreased 12.7% for New Construction. Median Closed Price increased 7.2%, Days on Market decreased 13.2% and Months Supply of Inventory increased 3.6%.
EXISTING HOME SALES
New listings decreased 5.2%; Pending sales decreased 5% and Total Inventory decreased 10.9% for Existing Homes. Median Closed Price Increased 11.1%, Days on Market remained flat and Months Supply of Inventory decreased 5.9%.
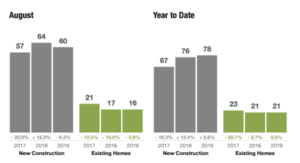
New & Existing Home Sales
This month, a total of 1484 homes were sold in the Omaha and surrounding areas which represents a decrease of 13.1% over the same time last year and a decrease of 7.4 % homes sales compared to YTD last year.
| #Homes Sold Aug 2018 | #Homes Sold Aug 2019 | #Homes Sold YTD 2018 | #Homes Sold YTD 2019 |
| 1290 | 1484 | 9743 | 9023 |
Existing Home Sales
This month, a total of 1298 existing homes were sold in the Omaha and surrounding areas, which is a -9.1% compared to the same time last year. When we take a look at Year to Date home sales of existing homes, there was a 6% decrease in homes sold.
| Closed Sales 2018 | Closed Sales 2019 | Closed Sales YTD 2018 | Closed Sales YTD 2019 |
| 1298 | 1180 | 8528 | 8014 |
Average Days on Market
The Average Days on market represents the number of days between when a property is listed and when an offer is accepted in a given month.
Days on Market – 12 Month Look Back
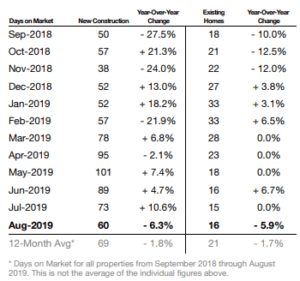
Days on Market by Property Type
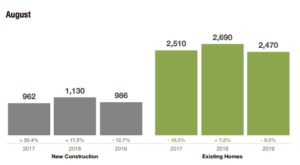
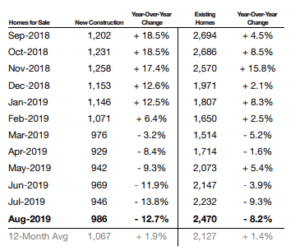
Inventory of Homes for Sale
The total number of Existing Homes for sale at the end of the month in the local Omaha area was 1,606 which is -10.9% over the same time last year.
New Construction was at 651 homes for sale at the end of the month, which is -12.7% over the same time last year.
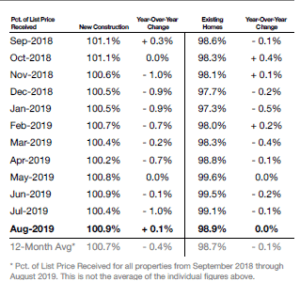
Percentage of List Price Received
Due to the low inventory of homes for sale, homes in Omaha are selling very close to the price they are originally listed for, which is great new for Homes Sellers in the Omaha area.
New Construction homes are up .4% which is the first time they are not in the negative. Existing homes are also up .4%.
Expired Listings in Omaha Nebraska
There were 174 home listings that expired in the month of August in the local Omaha area. 1895 listing contracts expired so far in 2019.
The seller may have relisted with the same agent, another agent, or may have postponed selling their house altogether. Another seller option is deciding to lease the property for rental income rather than selling.
Mortgage rates are still very low and Omaha is still a hot market for the home seller.
Bellevue Market Values
The Bellevue Nebraska Housing Market ended the month with the average home sold price of $213,546, an increase of $3,578 from the previous month.
| Average Sold Price | |
| Single Family Home | $213,546 |
| Townhouse | $165,500 |
Papillion Market Values
The Papillion Nebraska Housing Market ended the month with a decrease in the average single-family home price over the previous month of $14,000.
| Last Month | This Month |
| $319,081 | $304,111 |
Elkhorn Market Values
The Elkhorn Nebraska Housing Market ended the month with the average home price of $409,988 which is an increase of more than $40,000 over the previous month.
Bennington Market Values
The Bennington Nebraska Housing Market ended the month with the average home price of $321,935 which is an increase of more 1.6% over the previous month.
LaVista Market Values
The LaVista Nebraska Housing Market ended the month with the average home price of $235,242 which is a decrease of 10.2% from the previous month.
Ralston Market Values
The Ralston Nebraska Housing Market ended the month with the average home price of $189,542, which is an increase of 7.8% from the previous month.
Home Values by City
The Average Home Sale Price of Homes for Sale in Omaha and surrounding Communities by City
| City | Average Sold Price |
| Bellevue | $210,598 |
| Bennington | $321,935 |
| Blair | $189,865 |
| Elkhorn | $409,988 |
| Fort Calhoun | $320,333 |
| Fremont | $181,064 |
| La Vista | $235,242 |
| Lincoln | $228,783 |
| Louisville | $242,416 |
| Omaha | $237,285 |
| Papillion | $304,111 |
| Plattsmouth | $236,422 |
| Ralston | $189,542 |
| Springfield | $310,071 |
| Valley | $252,677 |
| Waterloo | $694,177 |
Average Home Sale Prices by Zip Code, City & County
Search the average home sale price by city, zip code or County.
| Zip Code | City | County | Average Sales Price |
| 68005 | Bellevue | Sarpy | $169,681 |
| 68007 | Bennington | Douglas | $321,294 |
| 68008 | Blair | Washington | $189,865 |
| 68022 | Elkhorn | Douglas | $396,060 |
| 68023 | Fort Calhoun | Washington | $320,333 |
| 68028 | Gretna | Sarpy | $289,168 |
| 68046 | Papillion | Sarpy | $308,807 |
| 68048 | Plattsmouth | Cass | $241,199 |
| 68059 | Springfield | Sarpy | $297,583 |
| 68064 | Valley | Douglas | $252,677 |
| 68069 | Waterloo | Douglas | $694,177 |
| 68102 | Omaha | Douglas | $238,050 |
| 68104 | Omaha | Douglas | $155,065 |
| 68105 | Omaha | Douglas | $171,096 |
| 68106 | Omaha | Douglas | $180,379 |
| 68107 | Omaha | Douglas | $103,782 |
| 68108 | Omaha | Douglas | $187,155 |
| 68110 | Omaha | Douglas | $64,000 |
| 68111 | Omaha | Douglas | $80,605 |
| 68112 | Omaha | Douglas | $138,312 |
| 68114 | Omaha | Douglas | $321,785 |
| 68116 | Omaha | Douglas | $264,220 |
| 68117 | Omaha | Douglas | $140,388 |
| 68118 | Omaha | Douglas | $302,363 |
| 68122 | Omaha | Douglas | $190,939 |
| 68123 | Omaha | Douglas | $235,379 |
| 68124 | Omaha | Douglas | $303,032 |
| 68127 | Omaha | Douglas | $190,584 |
| 68128 | Omaha | Douglas | $234,043 |
| 68130 | Omaha | Douglas | $381,211 |
| 68131 | Omaha | Douglas | $223,093 |
| 68132 | Omaha | Douglas | $331,188 |
| 68133 | Papillion | Sarpy | $291,483 |
| 68134 | Omaha | Douglas | $175,131 |
| 68135 | Omaha | Douglas | $280,246 |
| 68136 | Omaha | Douglas | $308,714 |
| 68137 | Omaha | Douglas | $189,886 |
| 68138 | Omaha | Sarpy | $174,043 |
| 68142 | Omaha | Douglas | $324,436 |
| 68144 | Omaha | Douglas | $203,478 |
| 68147 | Bellevue | Sarpy | $195,580 |
| 68152 | Omaha | Douglas | $217,545 |
| 68154 | Omaha | Douglas | $266,934 |
| 68157 | Omaha | Sarpy | $182,250 |
| 68164 | Omaha | Douglas | $210,831 |
| Douglas | $210,444 | ||
| Sarpy | $253,072 | ||
| Cass | $242,993 | ||
| Washington | $244,360 |
